|
|

|
Detector Test System (II)
(Todavía no disponible en espańol)
(Click to enlarge)
Page 1 - Page 2
| |
|---|
|
Next figures (8 to 10) correspond to the integration process previous to
the cryostat cooling and temperature control tests.
|
| |
|---|
Fig. 8a 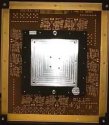 |
Fig. 8b 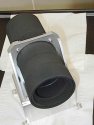 |
Fig. 8c 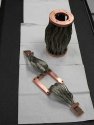 |
|
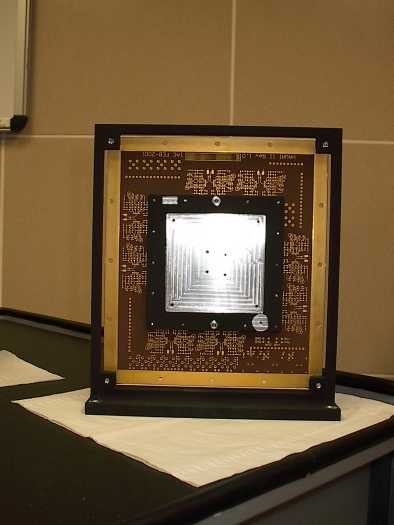
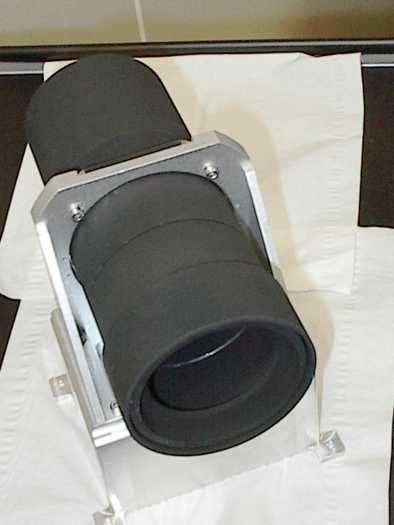
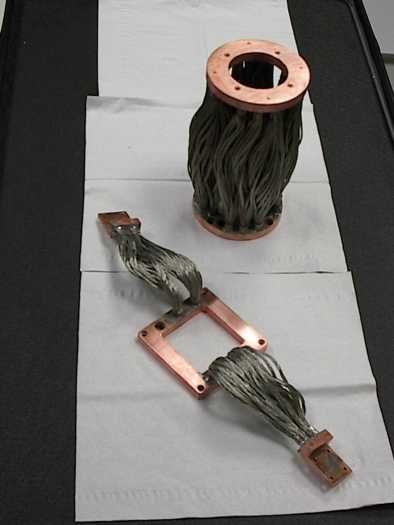
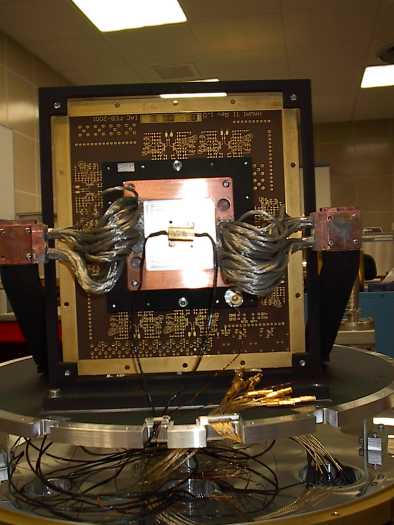
Figs. 8a, 8b, 8c. Different components of the detector tests system: spare fan-out board
free of detector and connections on its mounting interface (Fig. 8a),
baffle system and mounting interface (Fig. 8b) and thermal links (Fig.
8c).
|
| |
|---|
Fig. 9a  |
Fig. 9b 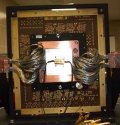 |
|
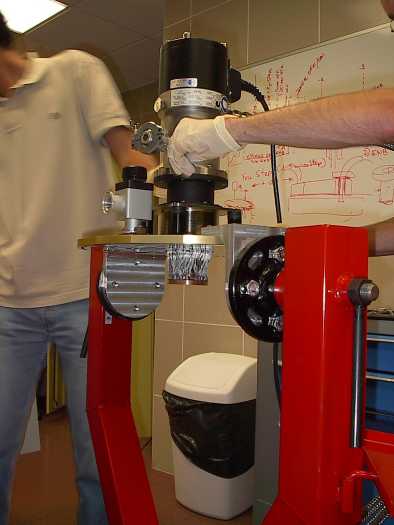
Figs. 9a and 9b. Cooling system: view of the thermal link connection mounted between the
first and the second stages of the cold head of the cold cycle cooler
(Fig. 9a) and detector fan-out board with thermal links and temperature
control resistor attached (Fig. 9b).
| | |
|---|
Fig. 10a  |
Fig. 10b 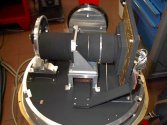 |
|
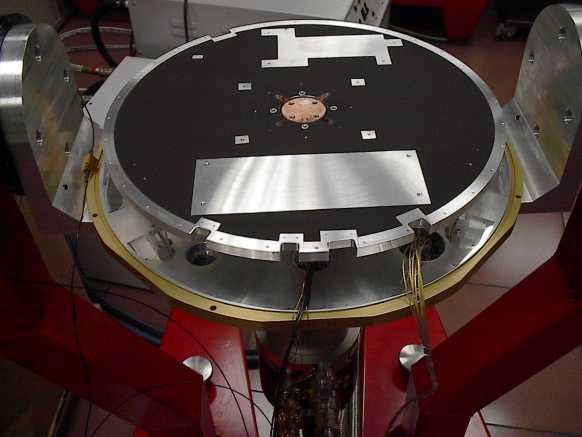
Figs. 10a and 10b. Cold bench (Fig. 10a) mounted and connected to the cryostat cover and
cold cycle cooler (underneath). View with most of the components mounted
on it before closing the cryostat (Fig. 10b).
| | |
|---|
Fig. 11a 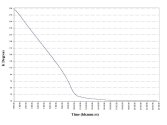 |
Fig. 11b 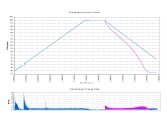 |
|
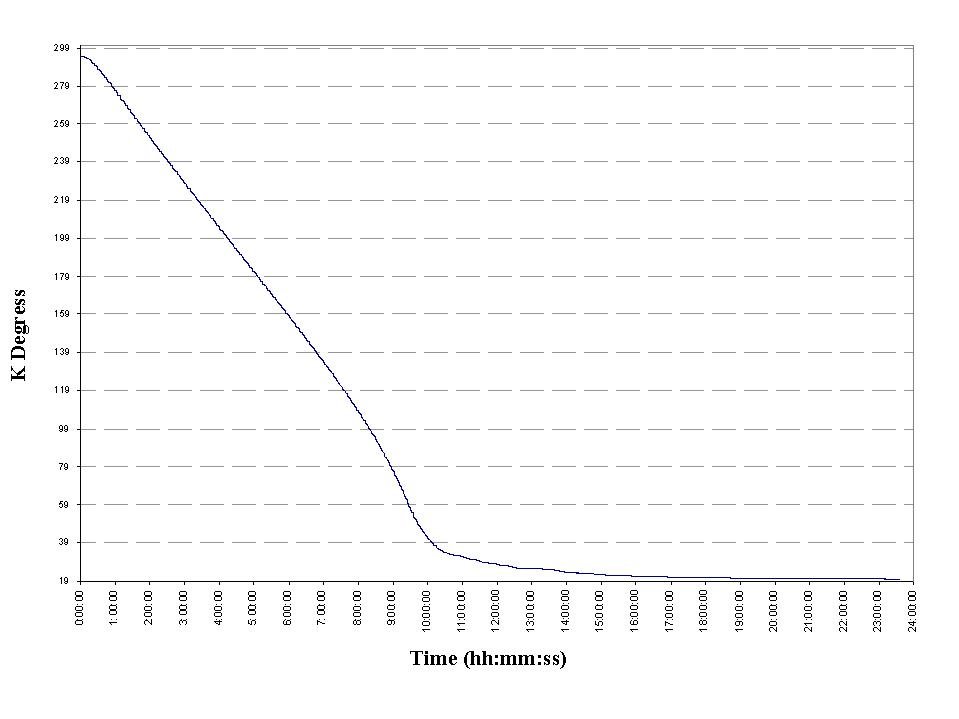
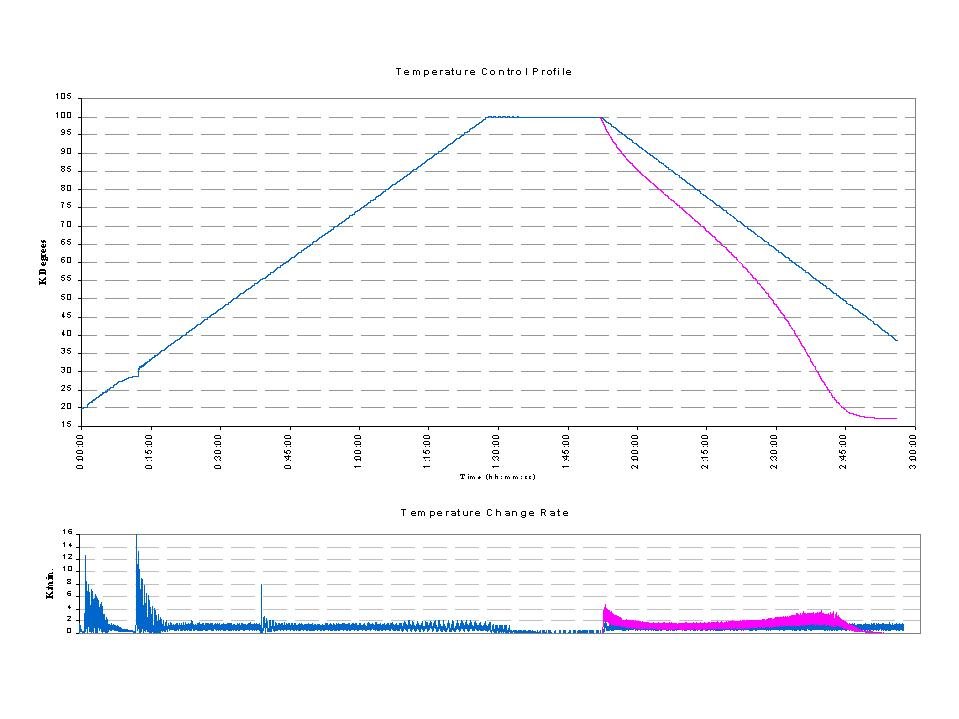
Figs. 11a and 11b. Cooling down temperature profile of the cryostat (Fig. 11a);
working temperature of 70 K was reached in about 10 hours.
First detector temperature control tests (Fig. 11b): the blue line shows
the temperature controlled profile of the detector fan-out board; the
pink line shows the cooling profile when control is disabled. Lower plot
shows the temperature change rate of the upper profile (K/min.), giving
an idea of the level of stabilisation (less than 1 K for constant
temperature). The precision reached is of one cent of degree.
|
Page 1 - Page 2
|
|